This was originally published for Nested Knowledge. A "nest" is Nested Knowledge's product—effectively a meta-analysis.
Statistical Inference on Citation Networks and Literature Search
In this article, we explore the citation network encountered in a literature search for ischemic stroke treatment devices.
About
Literature Search
In order to build a meta-analytical database, Nested Knowledge searches a large volume of publications indexed in medical journal literature databases (e.g. PubMed). Searches are executed via keyword search or MeSH tag matching, often resulting in large result sets of studies to consider for inclusion in our database. The decision to use a study is based on inclusion criteria (e.g. the study must be a clinical trial, it must be published in English). These criteria are automated as much as possible, but the process of inclusion/exclusion still requires a good deal of time from our expert reviewers.
Citation Networks
Citation networks provide a medium to visualize & reason about a set of studies. For the graph theory uninitiated, studies may be formulated as points (nodes or vertices) and citations as connections between studies (edges). In the below example, we have 3 studies: A, B, & C. The connections between these points can be read as: "study A cites study B", and "study B cites study C".
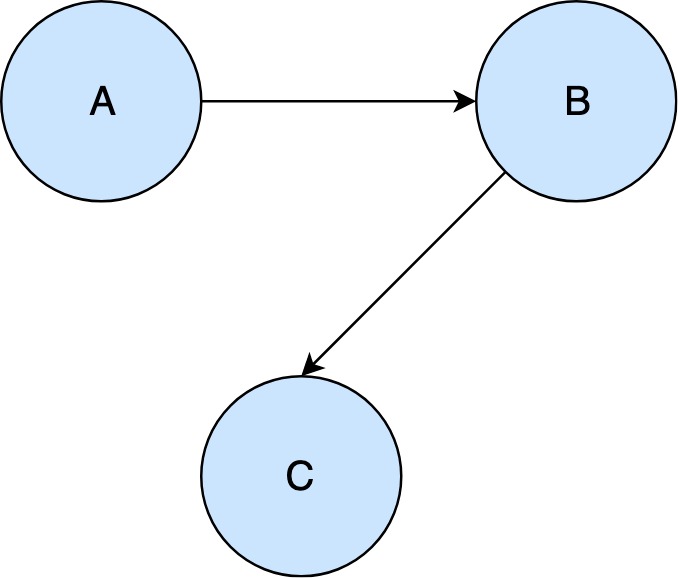
Citations networks can handle arbitrary pairwise relations- for example studies with multiple citations or no citations.

Ischemic Stroke Therapies
The first nest we built at Nested Knowledge investigates the question of how choice of therapy impacts patient outcomes for ischemic stroke sufferers. Treatments include thrombolytic therapies (e.g. IV-tPA) and thrombectomy (e.g. stent retrievers, contact aspiration). As such, we used literature search terms like:
- "stent retriever"
- "acute ischemic stroke trevo"
- "iv-tpa"
among 20 total terms. After automated & expert (manual) inclusion/exclusion, we have a list of studies like:
                        title search_term exclusion_reason
	Alternative technique for...       trevo     Not related
	[Mechanical thrombectomy ...       trevo Foreign Language
	Haloperidol and Risperido...       trevo        non-human
	Optimizating Clot Retriev...       trevo     Not related
	Safety and Efficacy of Me...       trevo    Meta-analysis
	Mechanical thrombectomy w...       trevo     Not related
	Association of Rewarming ...       trevo     Not related
	Functional outcomes and r...       trevo    Meta-analysis
	...
All 8 of these studies were excluded for being non-English, non-human, or simply not being related to the research question.
In total, 3948 studies (!) were considered, and 67 were included, giving a hit rate of around 2%.
Citation Network
Using citation data, we can visualize the studies in the literature search. Note that the ~2,000 studies without citation were excluded from the network, to de-clutter the presentation.

A couple characteristics jump out:
- There are several disconnected components (for example, the outer donut). There are at least two large networks of studies that do not reference each other at all! This might suggest two totally distinct fields of study.
- There are several arms, or regions of dense connectivity, within the central network. This might suggest several sub-fields within the main field of study.
Adding in Inclusion
Let's make the network more useful by adding in whether a study was included (orange) or excluded (green).

Woah! There appears to be some interesting things going on here. Below are some observations, including possible explanations:
- The disconnected components (outer donut) contain no included studies
- Causal mechanism: Disconnected components may represent totally unrelated studies that happened to match keywords.
- The two arms we identified above (now at 1:30 & 10:00 on the clockface) also contain no included studies
- Causal mechanism: These arms represent unrelated sub-fields (e.g. hemorrhagic stroke) which would tend to contain a dense citation network
- Causal mechanism: These arms represent undesirable study types (e.g. non-human studies) which would tend to cite one another.
- In general, cited studies lie at the center of the network & are large points (size is dictated by number of citations), meaning they are densely connected with one another
- Causal mechanism: Included studies (which are only original clinical trials in this case) are generally high quality research and therefore well-cited, or alternatively cited by well-cited studies.
- Causal mechanism: Existing meta-analyses tend to have immediate citations to the same set of clinical trials
These insights lead to a hypothesis:
Included studies tend to lie close to one another on the citation network
where "lying close" is defined by shortest path between two studies. This hypothesis is meaningful because, if true, it suggests a method for reducing time spent on literature search inclusion/exclusion. After a certain point in time in the search, if a study is not near other included studies, we might feel confident that the study will be excluded. We could then move it to the bottom of the priority list or even auto-exclude it, resulting in saved time for our expert reviewers.
So, how do we test the significance of this hypothesis?
Inference on Networks
Spatial Autocorrelation
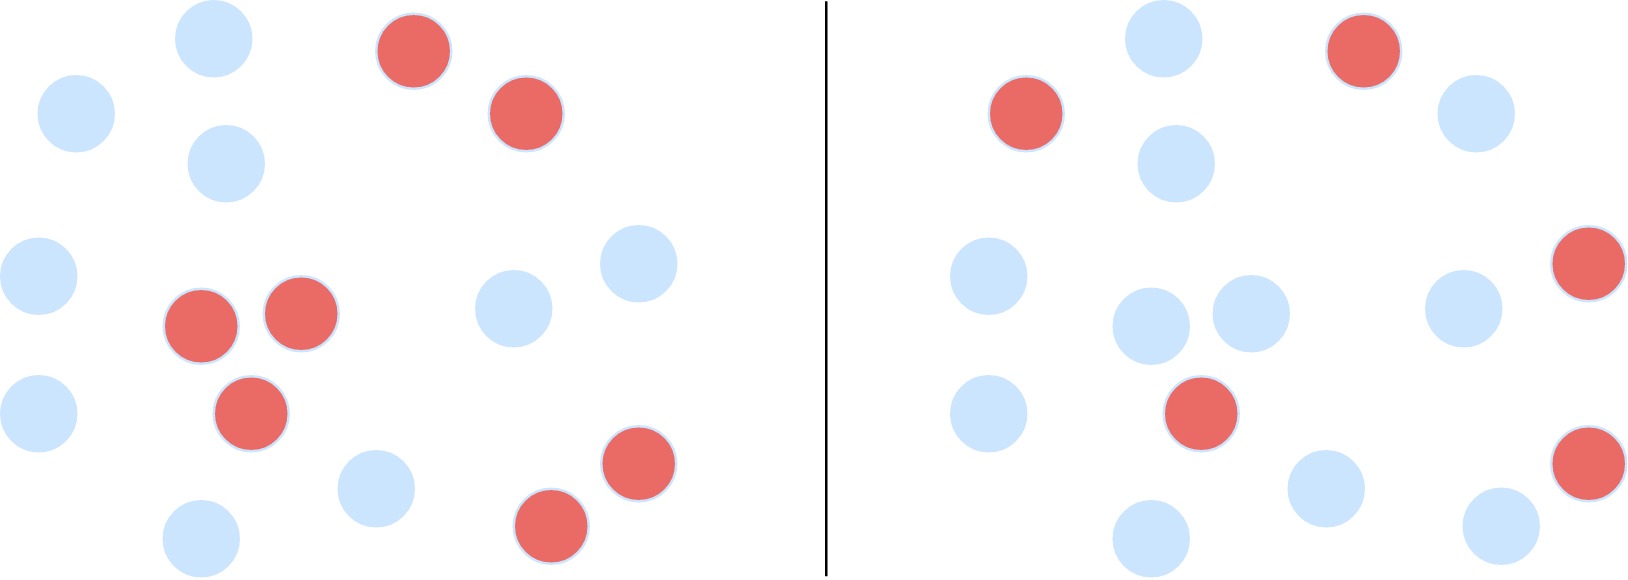
Spatial autocorrelation is a measure of how dependent the effect or occurrence of some phenomenon is on its surroundings. For example, the red coloration of the dots on the left show a high degree of spatial autocorrelation, while the ones on the right do not.
In this framework, our hypothesis can be reformulated:
Study inclusion is spatially autocorrelated.
Moran's I is a commonly used statistic for measuring spatial autocorrelation. For network data, Moran's I effectively takes a parameter describing how many neighbors to include (i.e. the degree of autocorrelation that we expect). We can visualize this parameter with the below network:
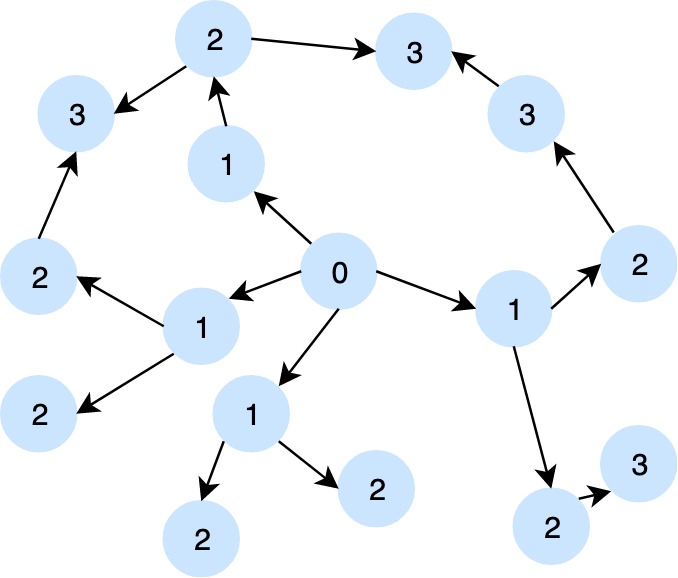
Focused on point 0:
- If we select Moran's I parameter to be 1, all points labelled 1 will be considered in the autocorrelation measurement.
- If we select Moran's I parameter to be 2, all points labelled 1 & 2 will be considered in the autocorrelation measurement.
- etc.
In other words, this parameter controls how far reaching we expect the autocorrelation to be.
Monte Carlo Simulation
Hypothesis testing is centered around demonstrating that a "null hypothesis" is not justifiable, which leads to a mutually exclusive alternative. Our (alternative) hypothesis is that "study inclusion is spatially autocorrelated". So, our null hypothesis could be "study inclusion is independent of spatial location". If this null hypothesis is true, it means that the observed location of inclusion is indistinguishable from random assignment of inclusion to locations.
Monte Carlo simulation is the literal implementation of this idea. The procedure is to:
- Compute the statistic of interest on the observed data
- Randomly reassign inclusion to studies (without replacement) and compute the statistic of interest
- Repeat (2) many times
The extent to which the statistic computed in (1) is extreme in the empirical distribution computed in (2) indicates statistical significance.
Testing Our Hypothesis
Below is a histogram of the Monte Carlo empirical distribution with Moran's I parameter of 1 and again for 2. The observed Moran's I is the black vertical bar.
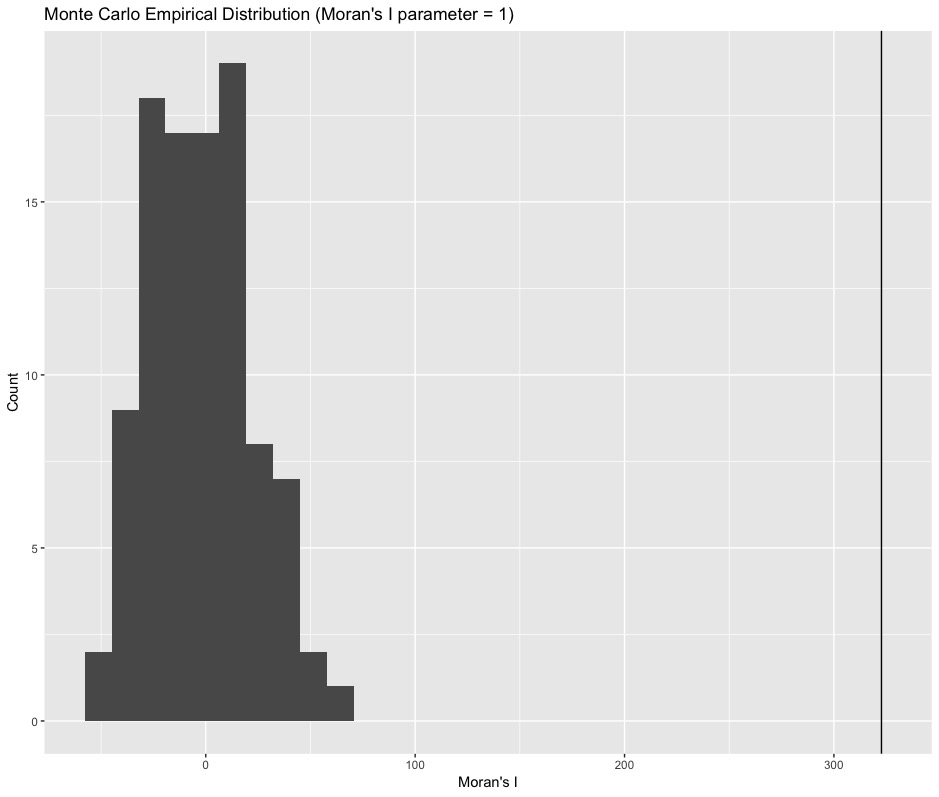

Given that 100 Monte Carlo trials were run, both p-values are reported as < .01, but the significance is certainly more convincing than that. Note the autocorrelation appears even more significant the more far-reaching we allow the autocorrelation to be (parameter=2).
In Action
Given the significant effect with plausible causal mechanisms, we'll be implementing inclusion probability ordering in literature search for future nests. On the immediate horizon is a comparison of flow diverter efficacy for hemorrhagic stroke- stay tuned!